
NPTOI Dashboard: Integrating CV Data and AI for Traffic Predictions
Published:
With powerful assistance from Codex, I recently developed the NPTOI Dashboard to support our FDOT project: Network Level Proactive Traffic Operations Indicator (NPTOI) Using Artificial Intelligence (AI) and Connected Vehicle (CV) Data Integration. The dashboard is an interactive web platform for visualizing CV data and AI-based traffic operation predictions. It was designed to support proactive traffic monitoring by integrating roadway-level mobility, safety, and prediction indicators into a map-based interface.
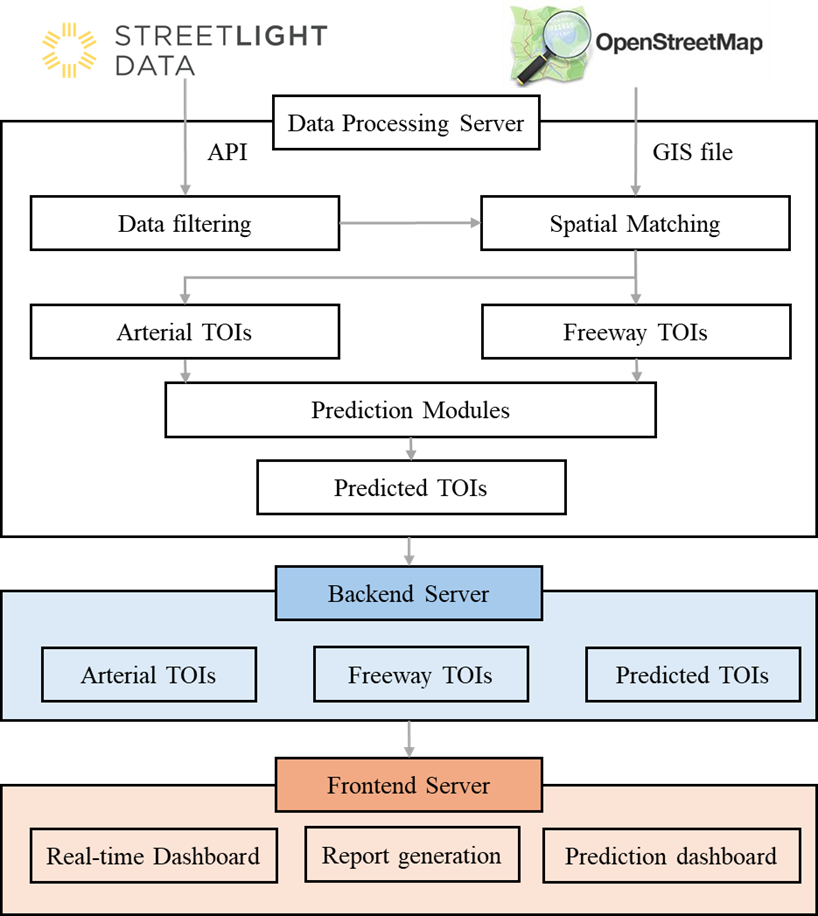
Based on Flask and modular JavaScript, the dashboard system is organized as a data-to-application pipeline that integrates CV data and roadway basemaps into a data processing server, a backend server, and a frontend interface. It provides an integrated interface for arterial and freeway networks, with controls for network type, date, time, segment coloring, and analysis mode. Users can switch among Historical View, Prediction Mode, and Network Ranking to explore traffic conditions from different perspectives.
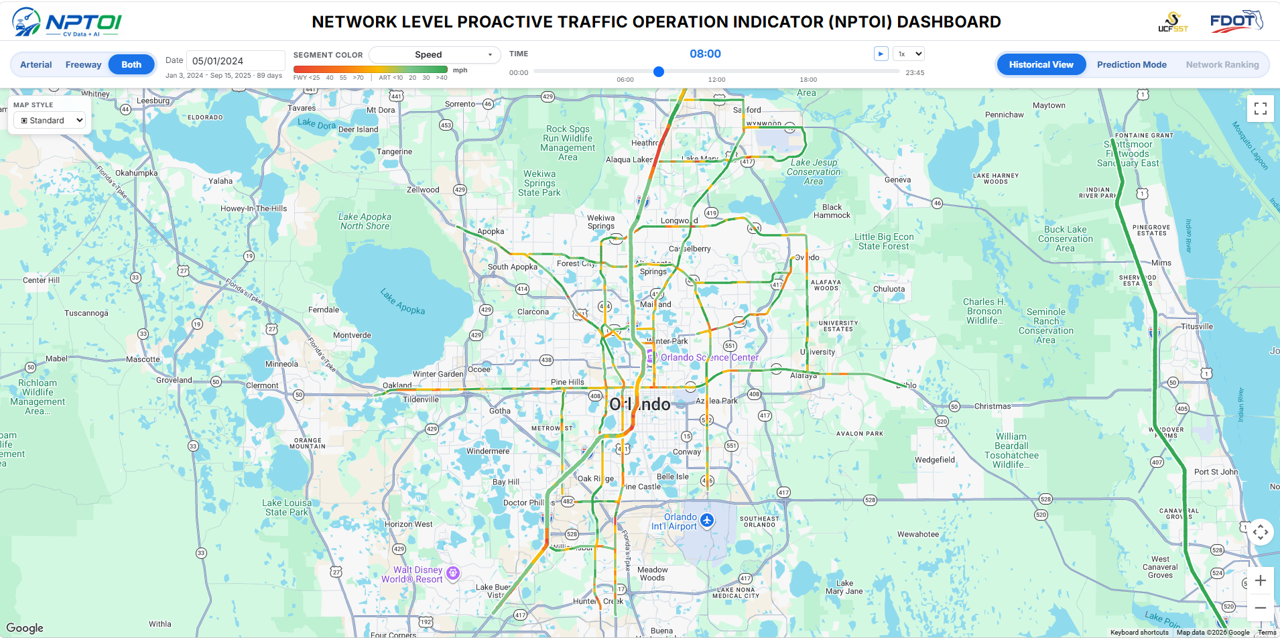
Historical View
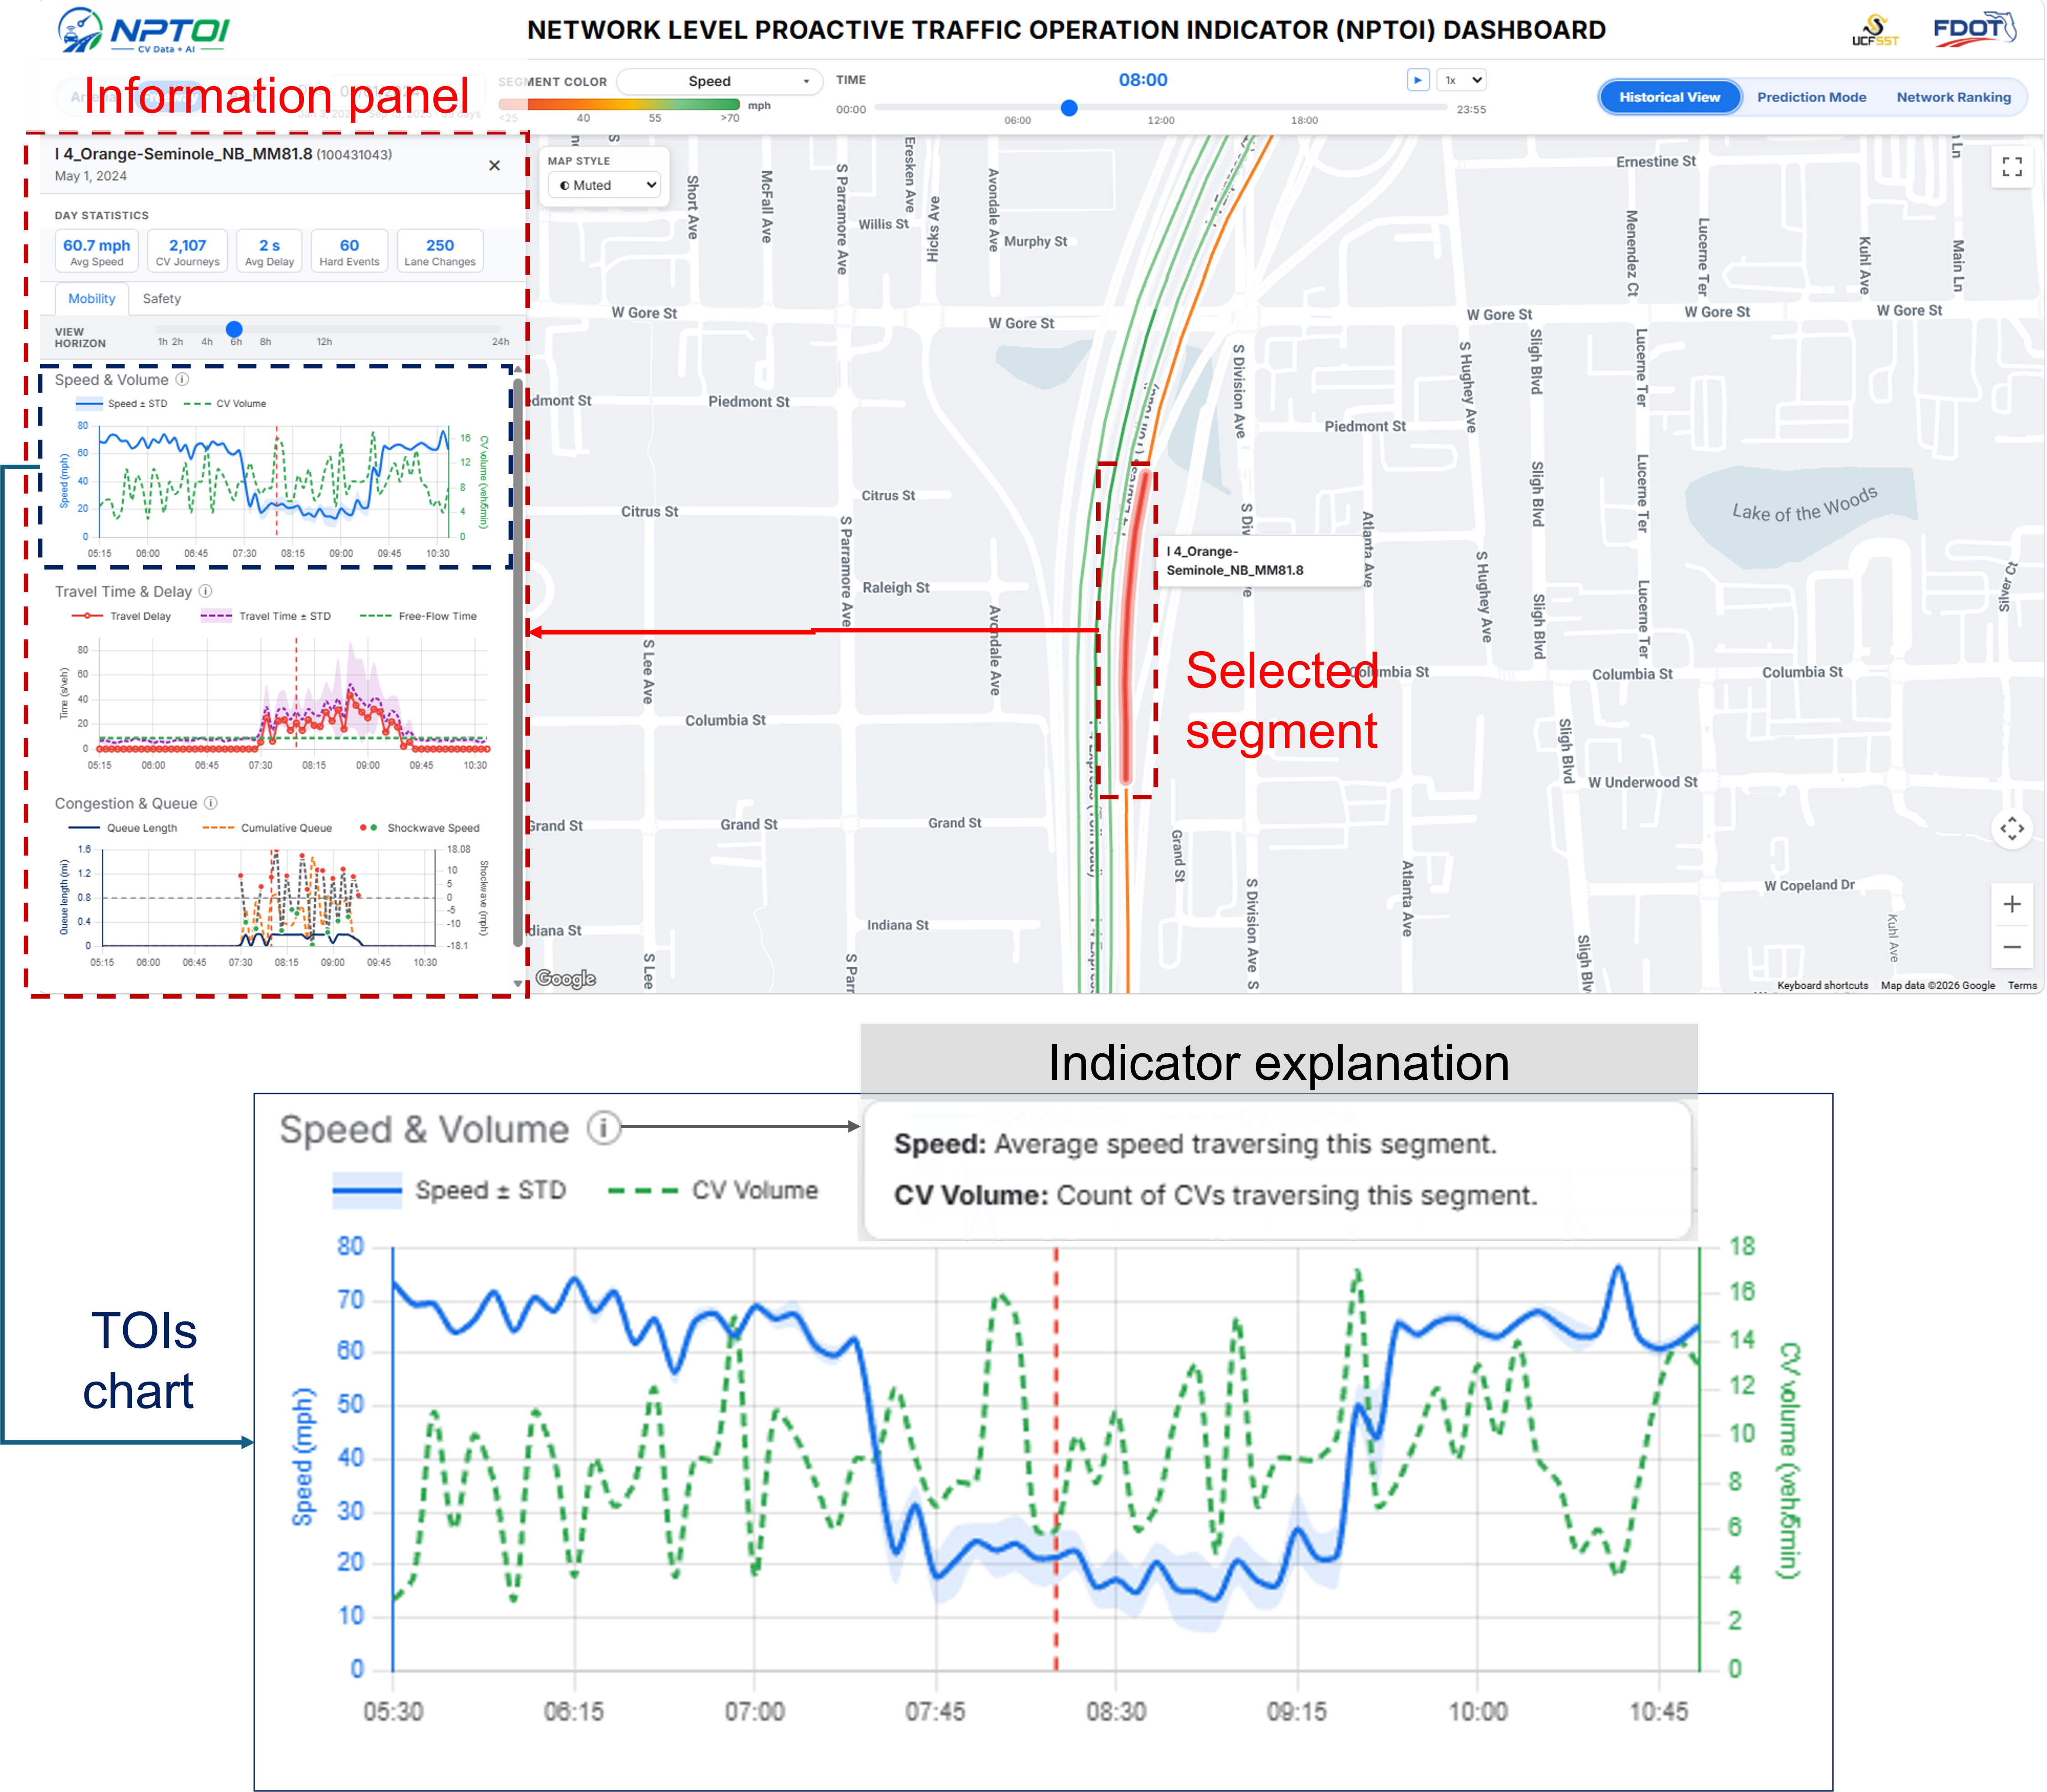
The Historical View module allows users to inspect segment-level traffic operation indicators over time. It includes mobility indicators such as speed, volume, travel delay, travel time, queue length, and signal performance, as well as safety-related indicators such as hard braking, hard acceleration, speeding, and lane-changing behaviors.
Prediction Mode
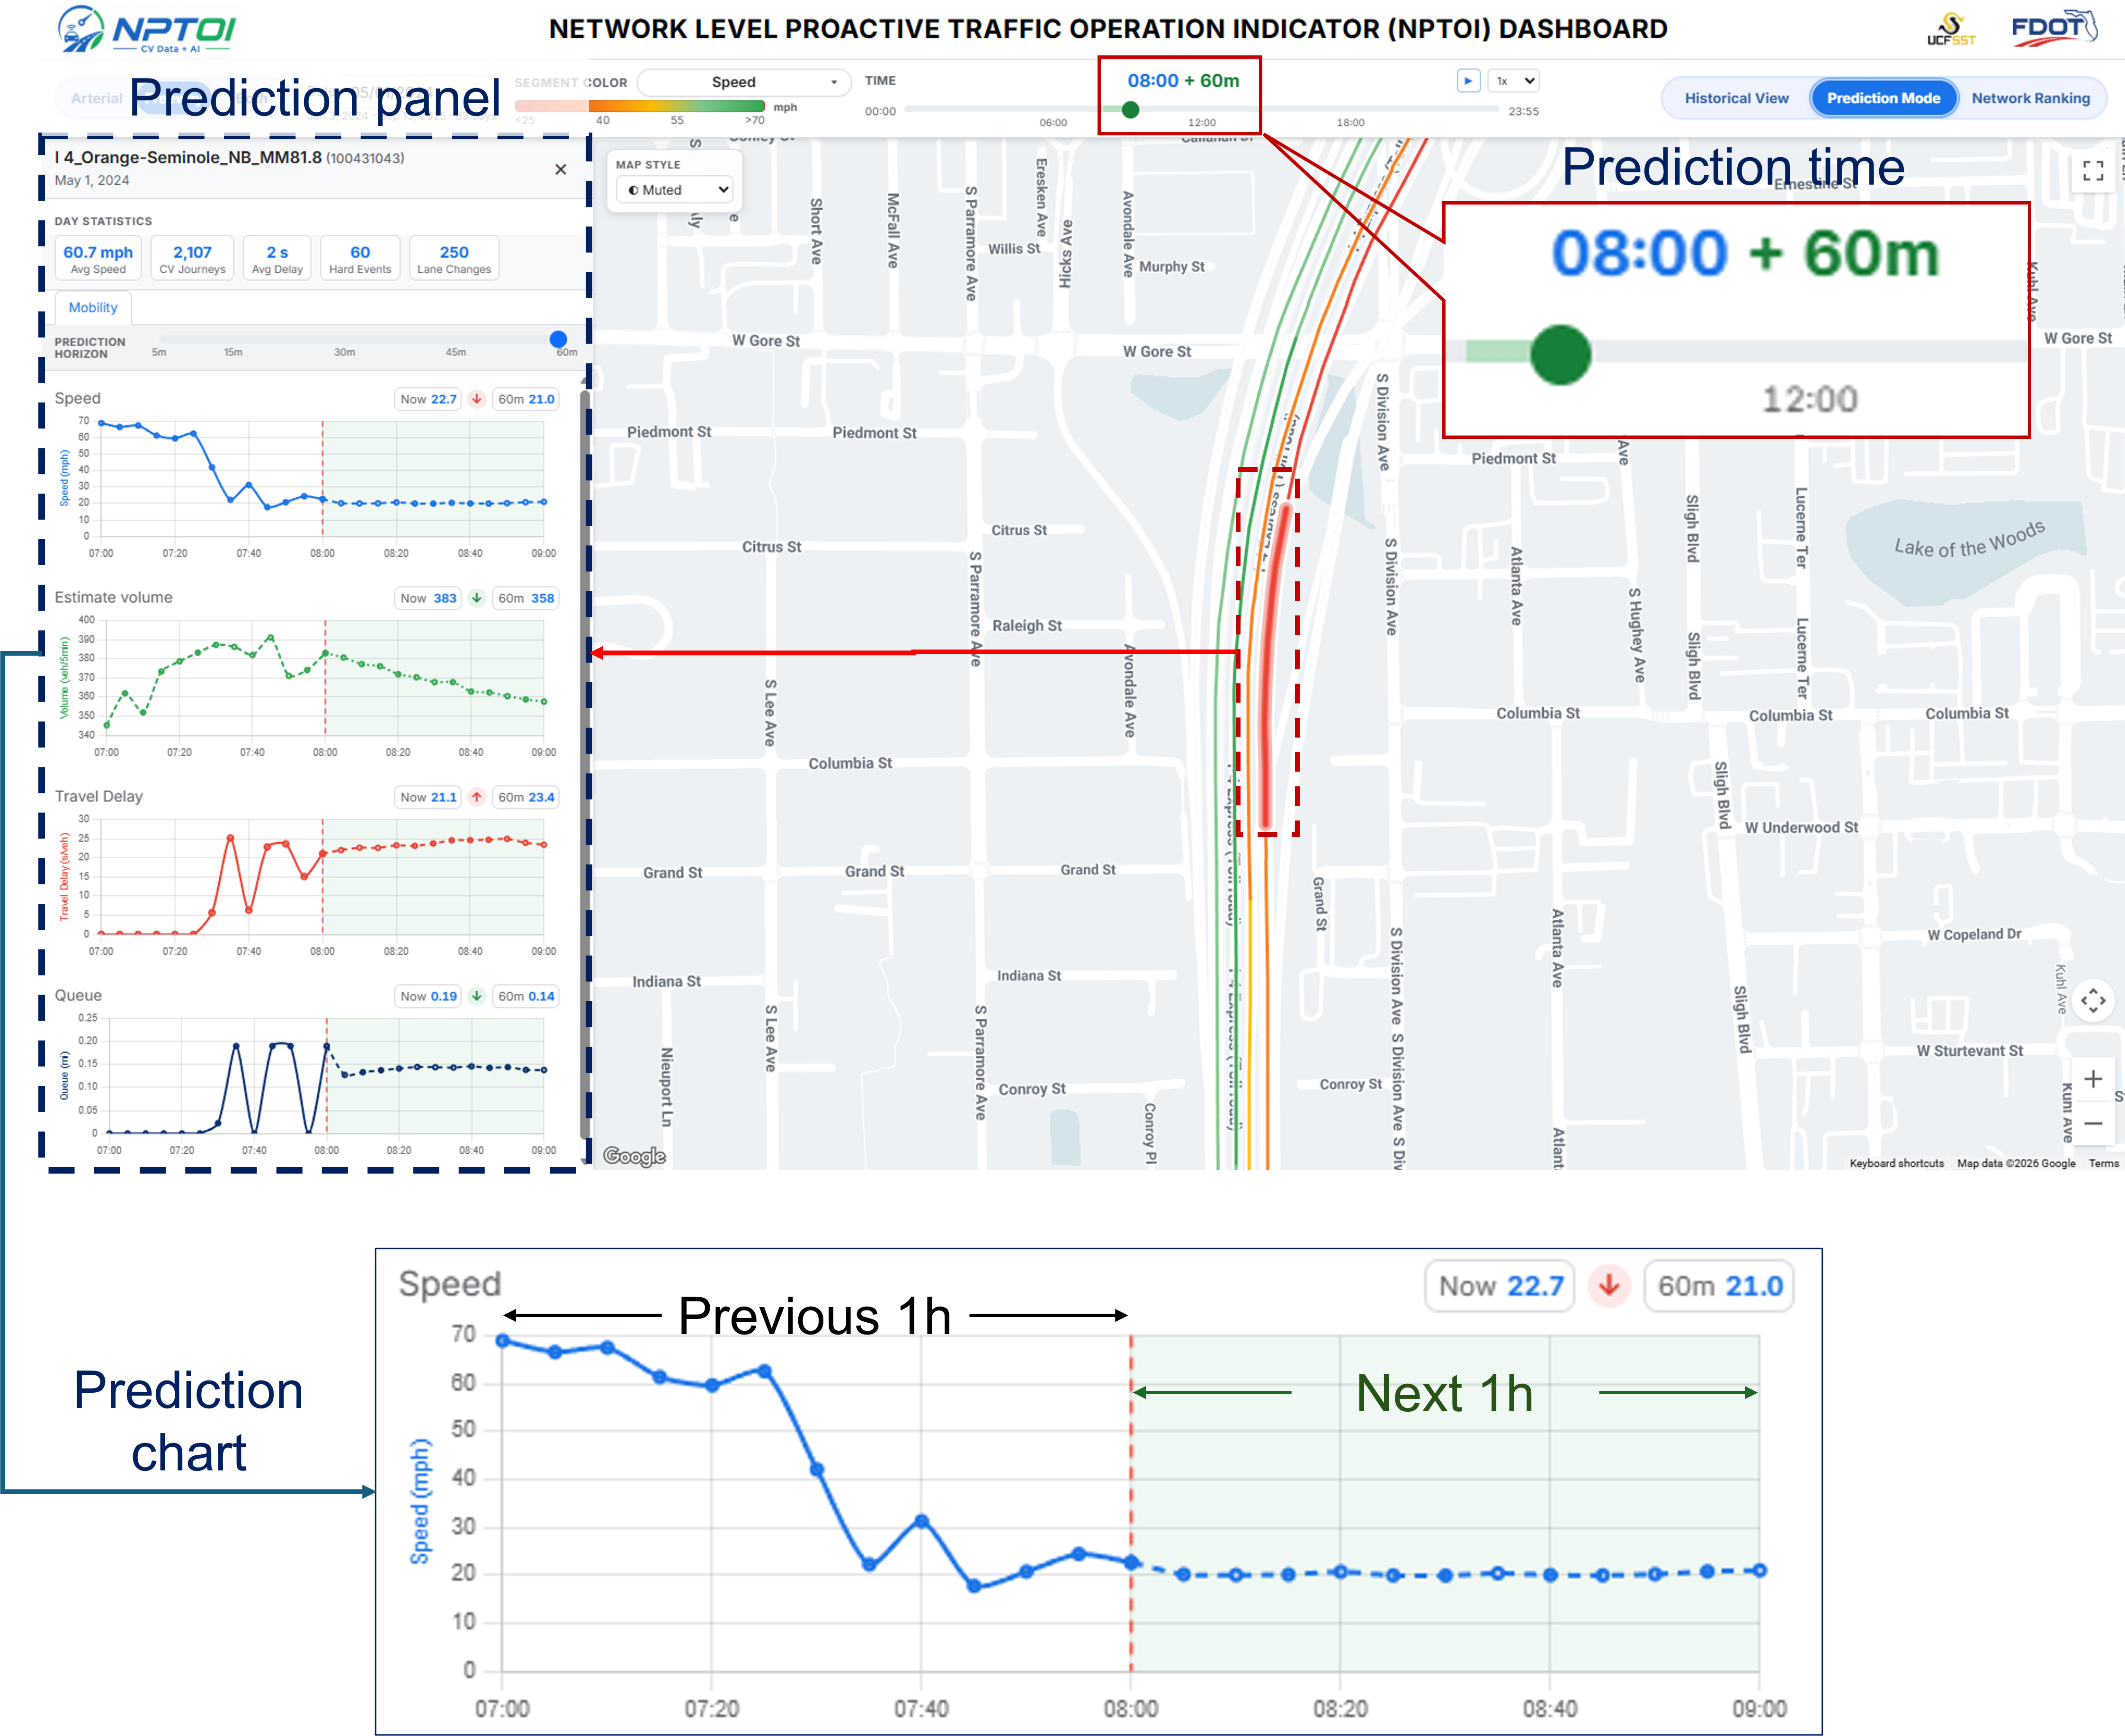
The Prediction Mode module visualizes short-term traffic forecasts for key traffic operation indicators, including speed, volume, delay, and queue length. It combines recent observed conditions with one-hour-ahead predictions, helping users examine how traffic conditions may evolve across the network.
Network Ranking
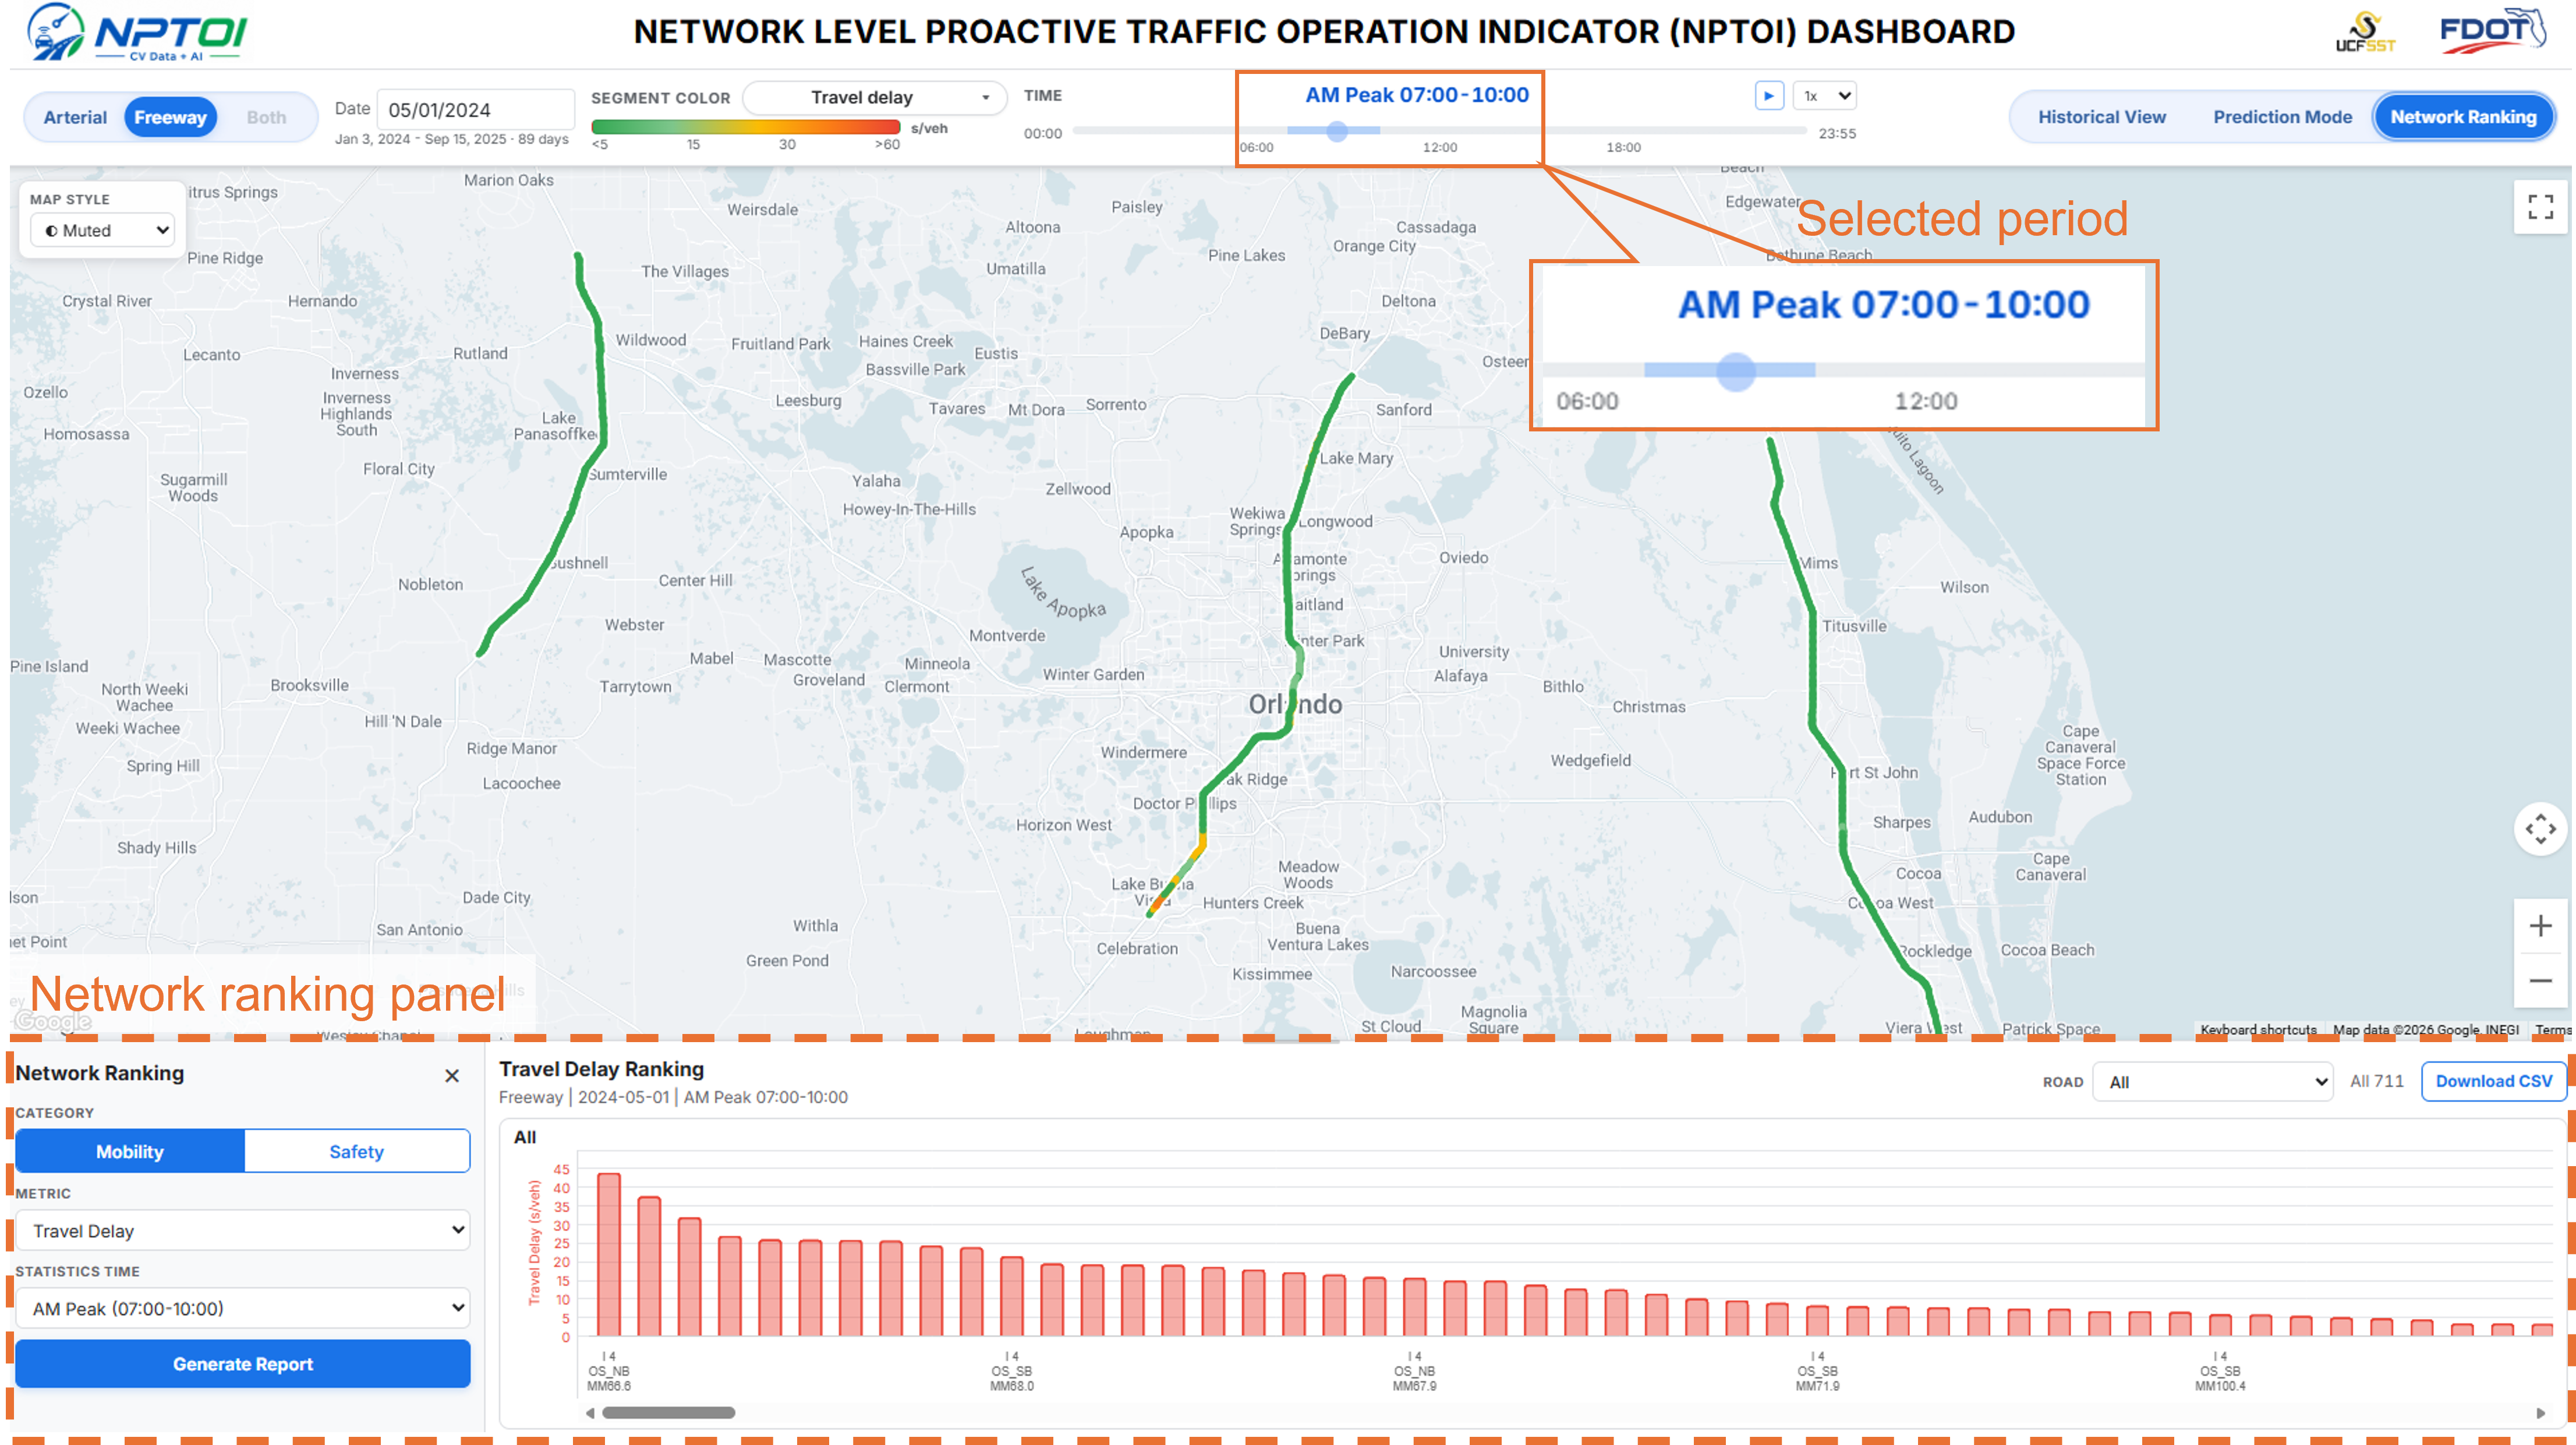
The Network Ranking module helps identify critical roadway segments based on selected mobility or safety indicators. Users can compare segments across different time windows, such as the current time, AM peak, PM peak, daytime, nighttime, or the full day. The results can also be exported for further analysis and reporting.
The current version (v1.1.0) is still an early-stage implementation. In future versions, I plan to expand the roadway networks, add more traffic analysis modules, and improve the interactive functions for traffic engineers and researchers. Stay tuned.